How to Use Fibonacci Retracement in Nifty and Bank Nifty Trading

What Fibonacci Retracement Actually Measures
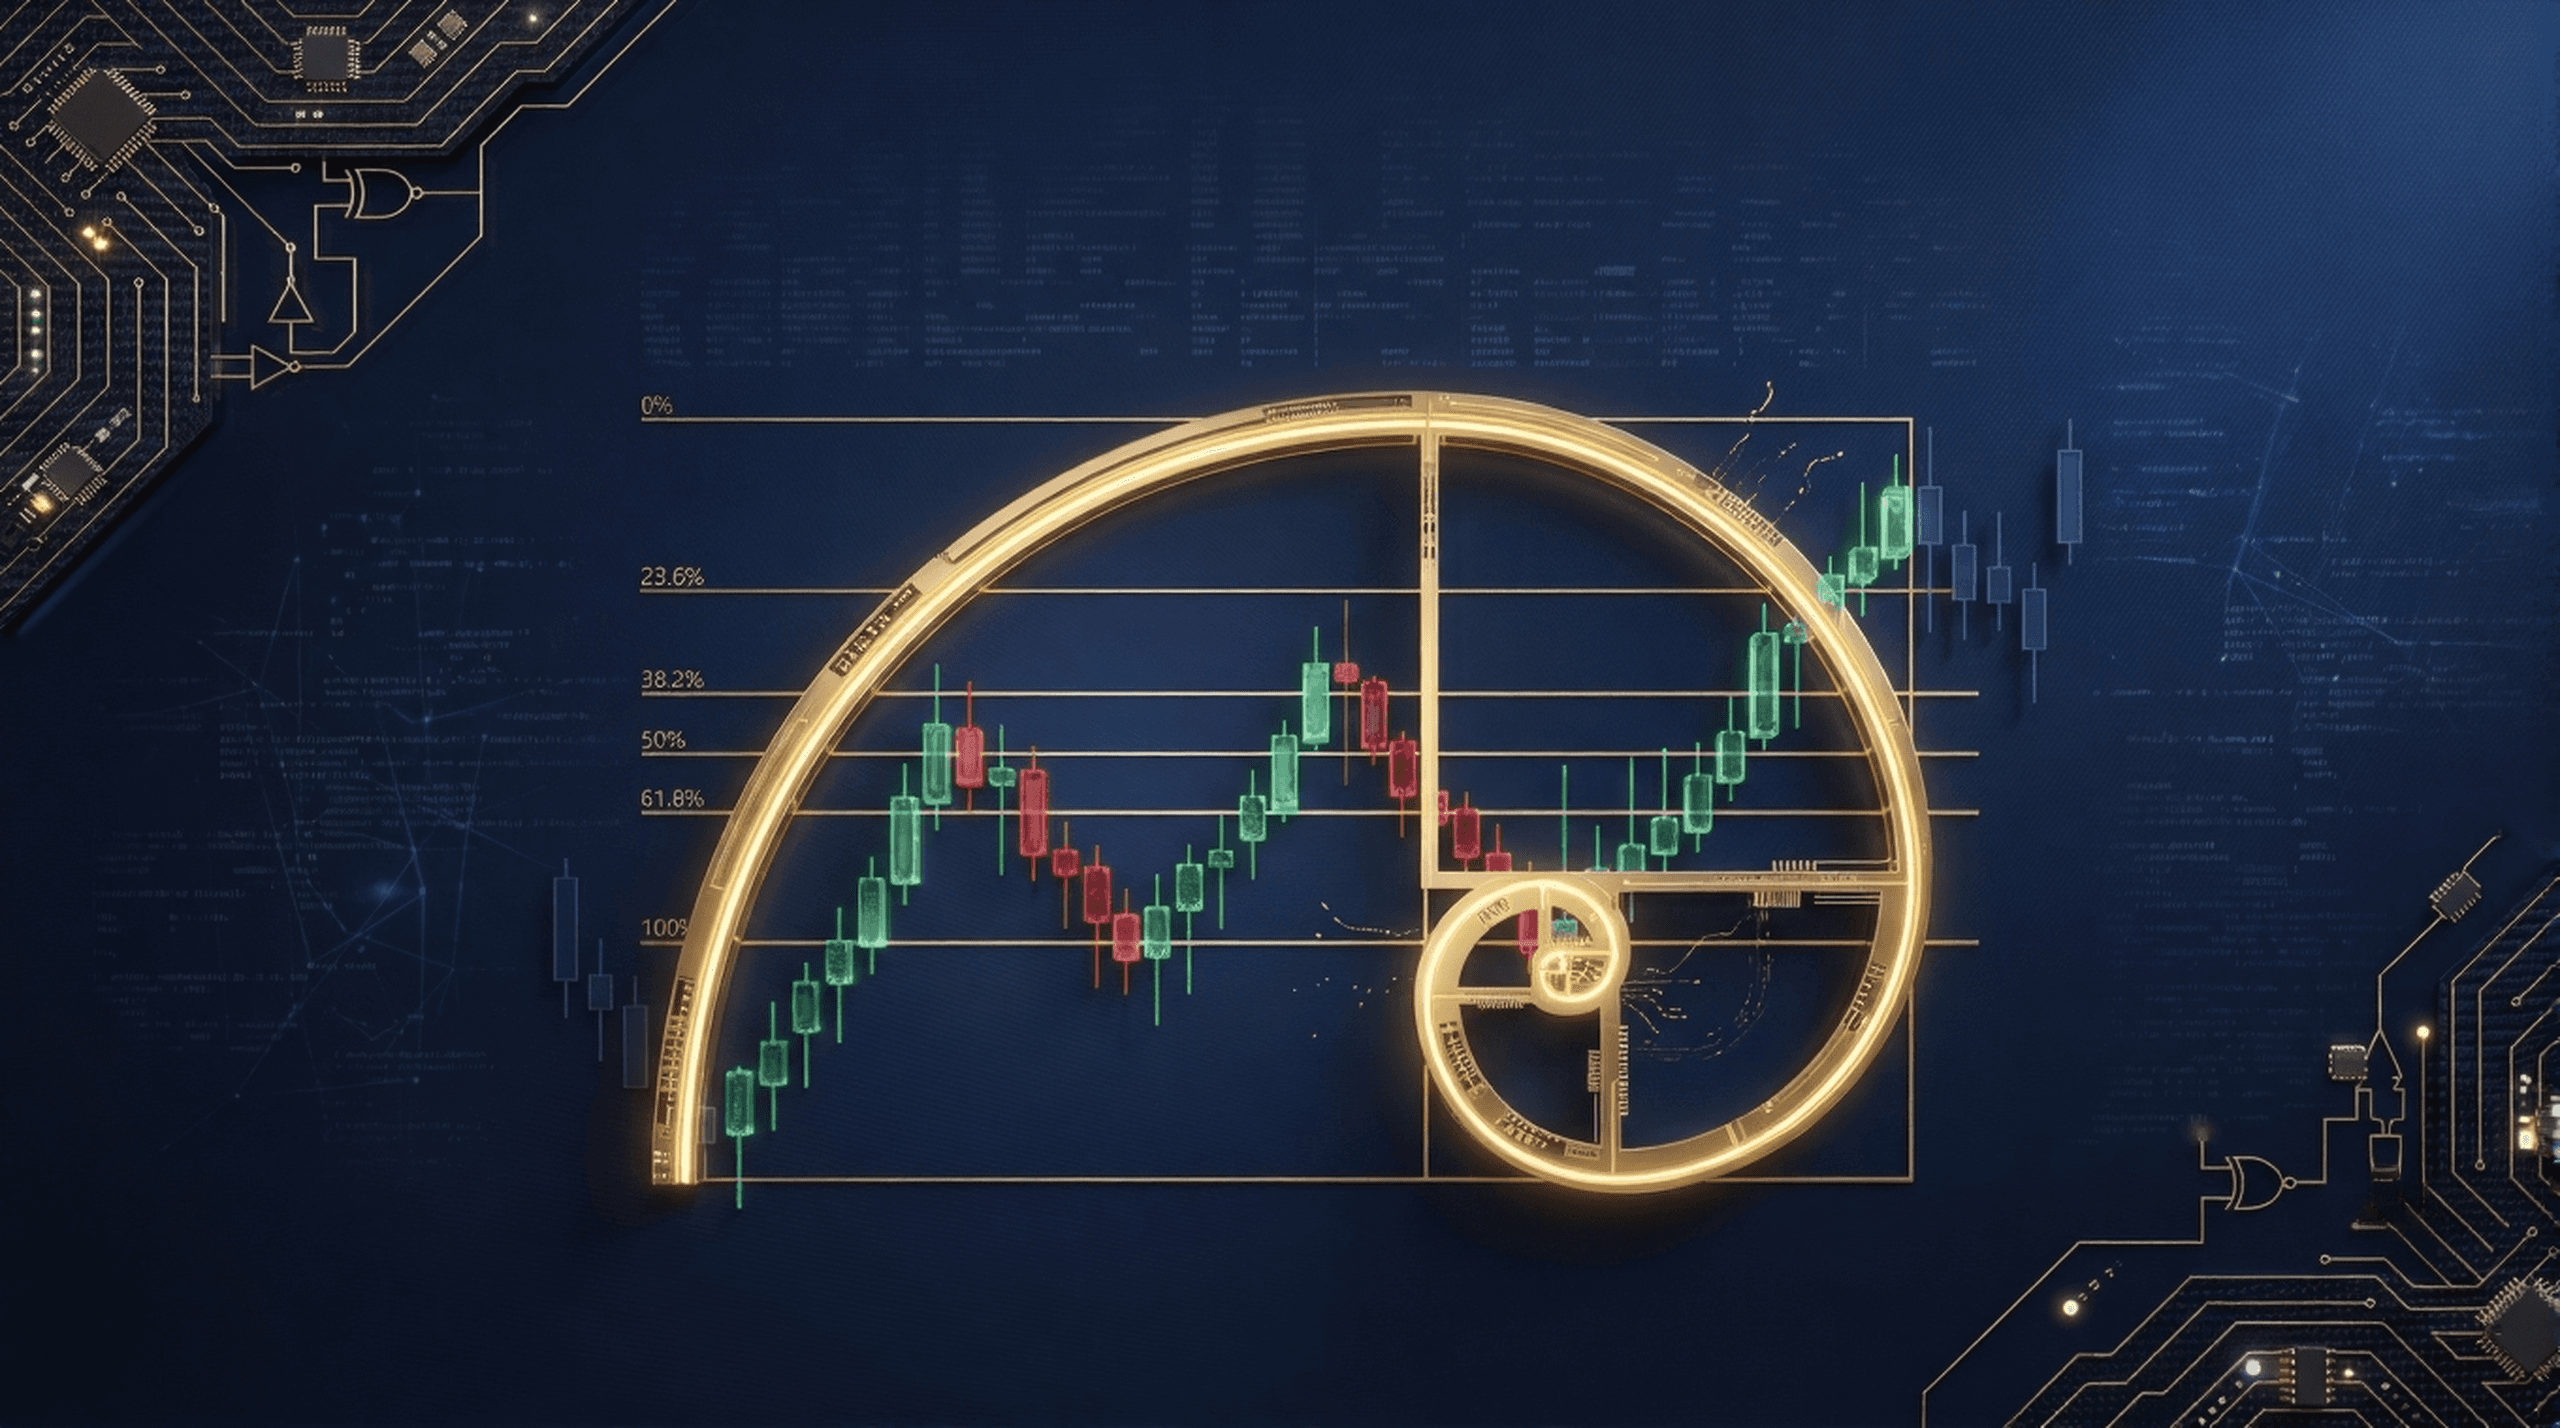
Fibonacci retracement is a way of marking the levels where a price move is statistically likely to pause or reverse after retracing part of its prior move. The tool draws horizontal lines at specific percentages — most commonly 23.6%, 38.2%, 50%, 61.8%, and 78.6% — between a recent swing high and swing low. The idea isn't that price obeys these numbers by some mathematical law; it's that enough market participants watch the same levels that they become self-reinforcing zones of interest, especially on heavily traded instruments like Nifty and Bank Nifty.
Drawing It Correctly
The tool is only useful if it's anchored to the right two points. For an uptrend, the retracement is drawn from the swing low to the swing high — the levels below the high then mark potential pullback zones before the trend resumes. For a downtrend, it's drawn from the swing high to the swing low, marking potential bounce zones before the decline continues.
The most common mistake is anchoring the tool to a minor, insignificant wiggle instead of a genuine, clearly defined swing point. A retracement drawn from a small, noisy move produces levels that are essentially meaningless — the swing points need to represent an actual, visually obvious high or low on the timeframe being traded.
The Levels That Matter Most
Not all Fibonacci levels carry equal weight in practice:
38.2% retracement tends to matter in strong trends, where a pullback that shallow often signals the trend has plenty of momentum left.
50% retracement, while not technically a Fibonacci ratio, is included on most charting platforms because price frequently reacts around the halfway point of a prior move — psychologically, it's the level where the move is exactly half-erased.
61.8% retracement is often treated as the boundary between a healthy pullback and a trend that may be losing structural integrity. A retracement beyond this level starts to raise the question of whether the prior move is actually reversing rather than just pausing.
Using It on Nifty and Bank Nifty Specifically
Both indices tend to respect retracement zones more reliably on higher timeframes (15-minute and above) than on very short intraday charts, where noise can produce false reactions at almost every level. A retracement zone that also lines up with a prior support or resistance level, a round number, or a moving average carries more weight than one sitting in isolation — confluence between multiple signals is generally more reliable than any single tool used alone.
Around Bank Nifty's weekly expiry specifically, retracement levels can behave differently than on a normal session — sharp intraday reversals driven by options positioning and time-decay dynamics can blow through levels that would otherwise hold on a calmer day. This is exactly the kind of session where the sizing discipline covered in how to size Bank Nifty options positions matters most — treating a retracement zone as a probability zone to watch, not a guaranteed reaction point, matters more on expiry days than on any other session.
What Fibonacci Retracement Isn't
It isn't an entry signal on its own. A price reaching the 61.8% level doesn't mean "buy" — it means that level is a zone worth watching for confirmation from something else: a candlestick reversal pattern, a volume spike, or a bounce off a level that also aligns with other technical structure. Used in isolation, a retracement tool will flag far more false reactions than genuine ones. Used as one input alongside price action and support/resistance, it becomes considerably more useful.
It also isn't predictive of when a reaction will happen, only where one is more likely. Price can sit at a retracement level for an extended period before reacting, or blow straight through it without pausing at all — the tool marks probability zones, not certainties.
A Simple Way to Practice It
Pick a recent, clearly defined swing on Nifty or Bank Nifty and draw the retracement after the fact — a simulated terminal like FutureFunding's makes this easy to do against real historical price data without any capital at risk. Note which levels price actually reacted to, and which it ignored. Doing this repeatedly across many past swings — rather than trying to apply it live on every single move — builds a much more accurate sense of which levels tend to matter on these specific indices, and which are frequently just noise.
This article is for general informational purposes and does not constitute financial advice.
Tags
Related Articles
Scalping in Indian Index Options: What It Actually Requires
Scalping looks appealing on paper: no overnight risk, many small opportunities. In practice it's one of the more demanding styles to execute well, and it concentrates exactly the behavioral patterns evaluation scoring is built to detect.
Read more →Swing Trading vs. Intraday: Choosing a Style for Your Evaluation Account
On a personal account, intraday vs. swing is mostly preference. On an evaluation account, it interacts directly with square-off rules, minimum active days, and daily loss limits. Picking a style that fights those mechanics is a common, avoidable failure point.
Read more →